
Natural Gas and Oil Forecast: Supply Risks Clash With 2025 Oversupply Outlook
Key Points:
- WTI crude pauses near $57.80 as geopolitical risk adds a premium, but 2025 supply surplus forecasts limit upside momentum.
- Energy markets balance short-term disruption risks against medium-term oversupply, keeping oil and gas outlooks finely split.
- Natural gas stabilises near $3.99 after a steep selloff, but descending trendlines continue to pressure recovery attempts.
Market Overview
WTI crude traded near $57.80 per barrel, pausing after four straight sessions of gains as markets weighed geopolitical tensions against longer-term supply dynamics. Disruptions linked to shipping enforcement actions in the Americas and continued strikes on energy infrastructure across Eastern Europe have added a risk premium, even though affected volumes represent less than 1% of global supply.
These developments highlight the fragility of key export routes and revenue streams for producing nations. Still, price gains remain contained.
Forecasts of a growing supply surplus in 2025 continue to cap upside, keeping oil and natural gas outlooks balanced between near-term risk support and medium-term oversupply pressures.
Natural Gas Price Forecast
Natural Gas (NG) Price Chart
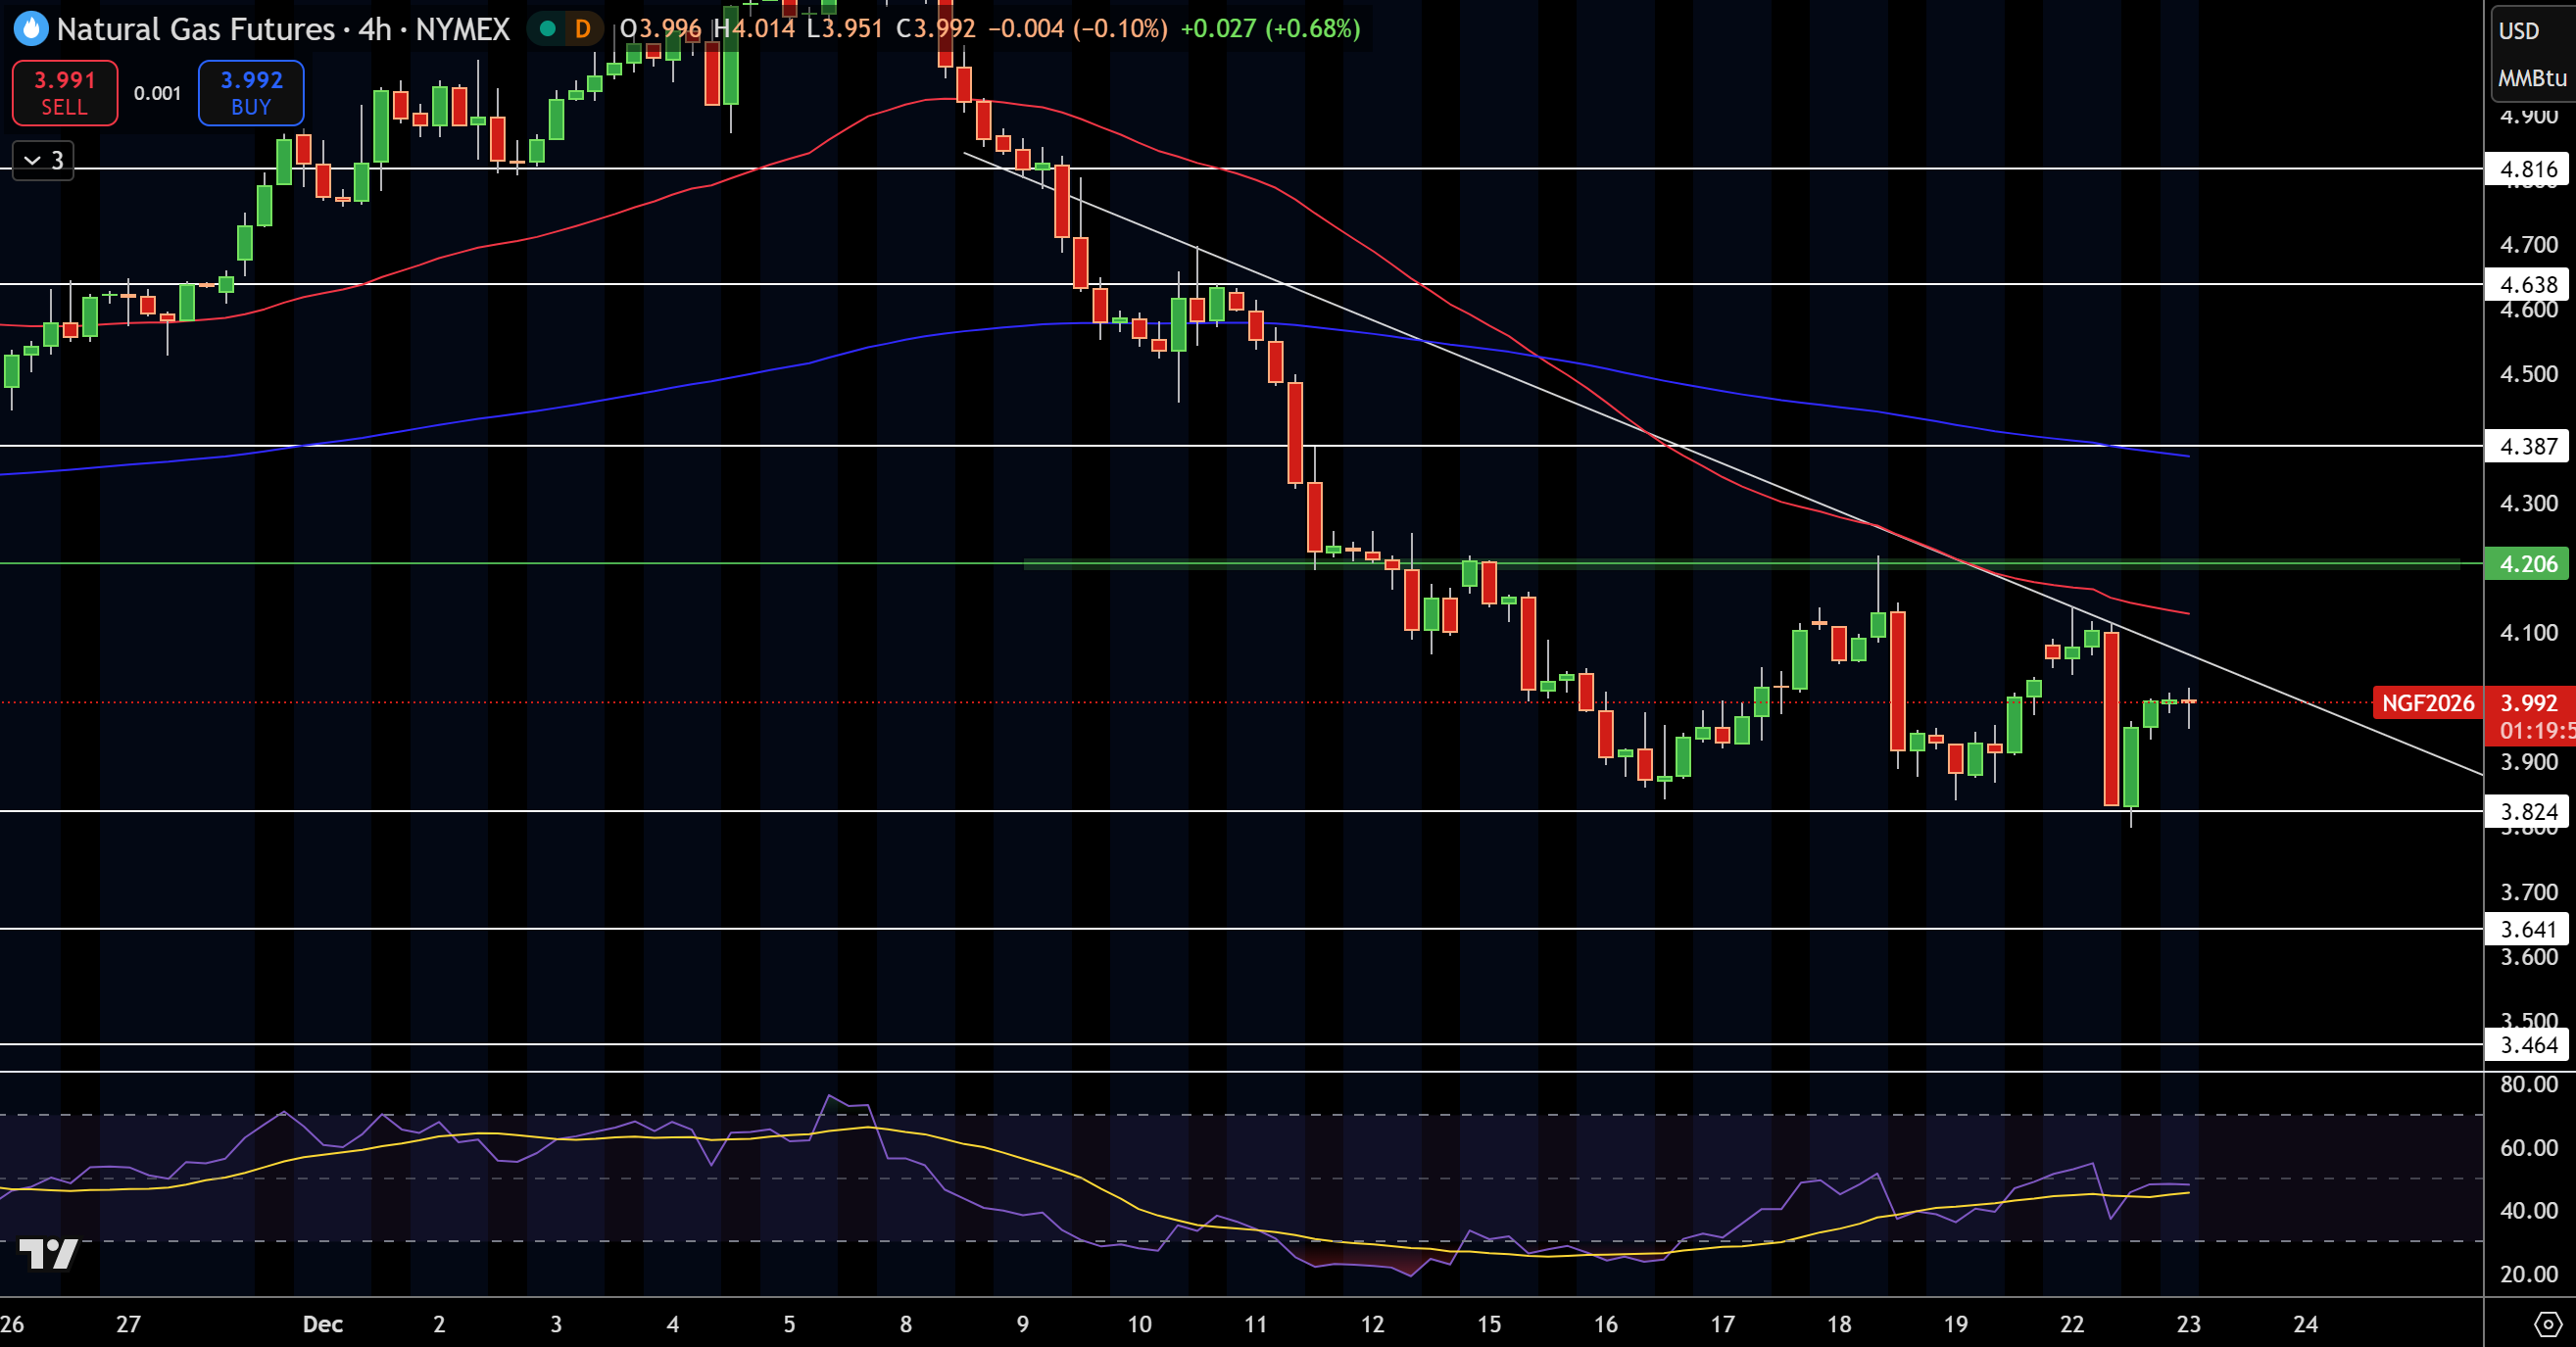
Natural gas futures are trading near $3.99, stabilising after a sharp selloff from the $4.80 high. On the 4H chart, price remains below a descending trendline that has guided lower highs since early December, keeping the broader bias pressured. Recent candles show smaller bodies and long wicks, pointing to short-term indecision rather than a clean reversal.
The rebound stalled near $4.10, which aligns with trendline resistance and the 50-EMA. The 200-EMA sits higher around $4.38, reinforcing overhead supply. Support is holding near $3.82, a level that has repeatedly attracted buyers. RSI has lifted toward 50, suggesting momentum is improving but not yet dominant.
Fibonacci from $4.80 to $3.82 shows price capped below the 38.2% retracement.
Trade idea is to sell below $3.95, target $3.70, stop above $4.15.
WTI Oil Price Forecast
WTI Price Chart
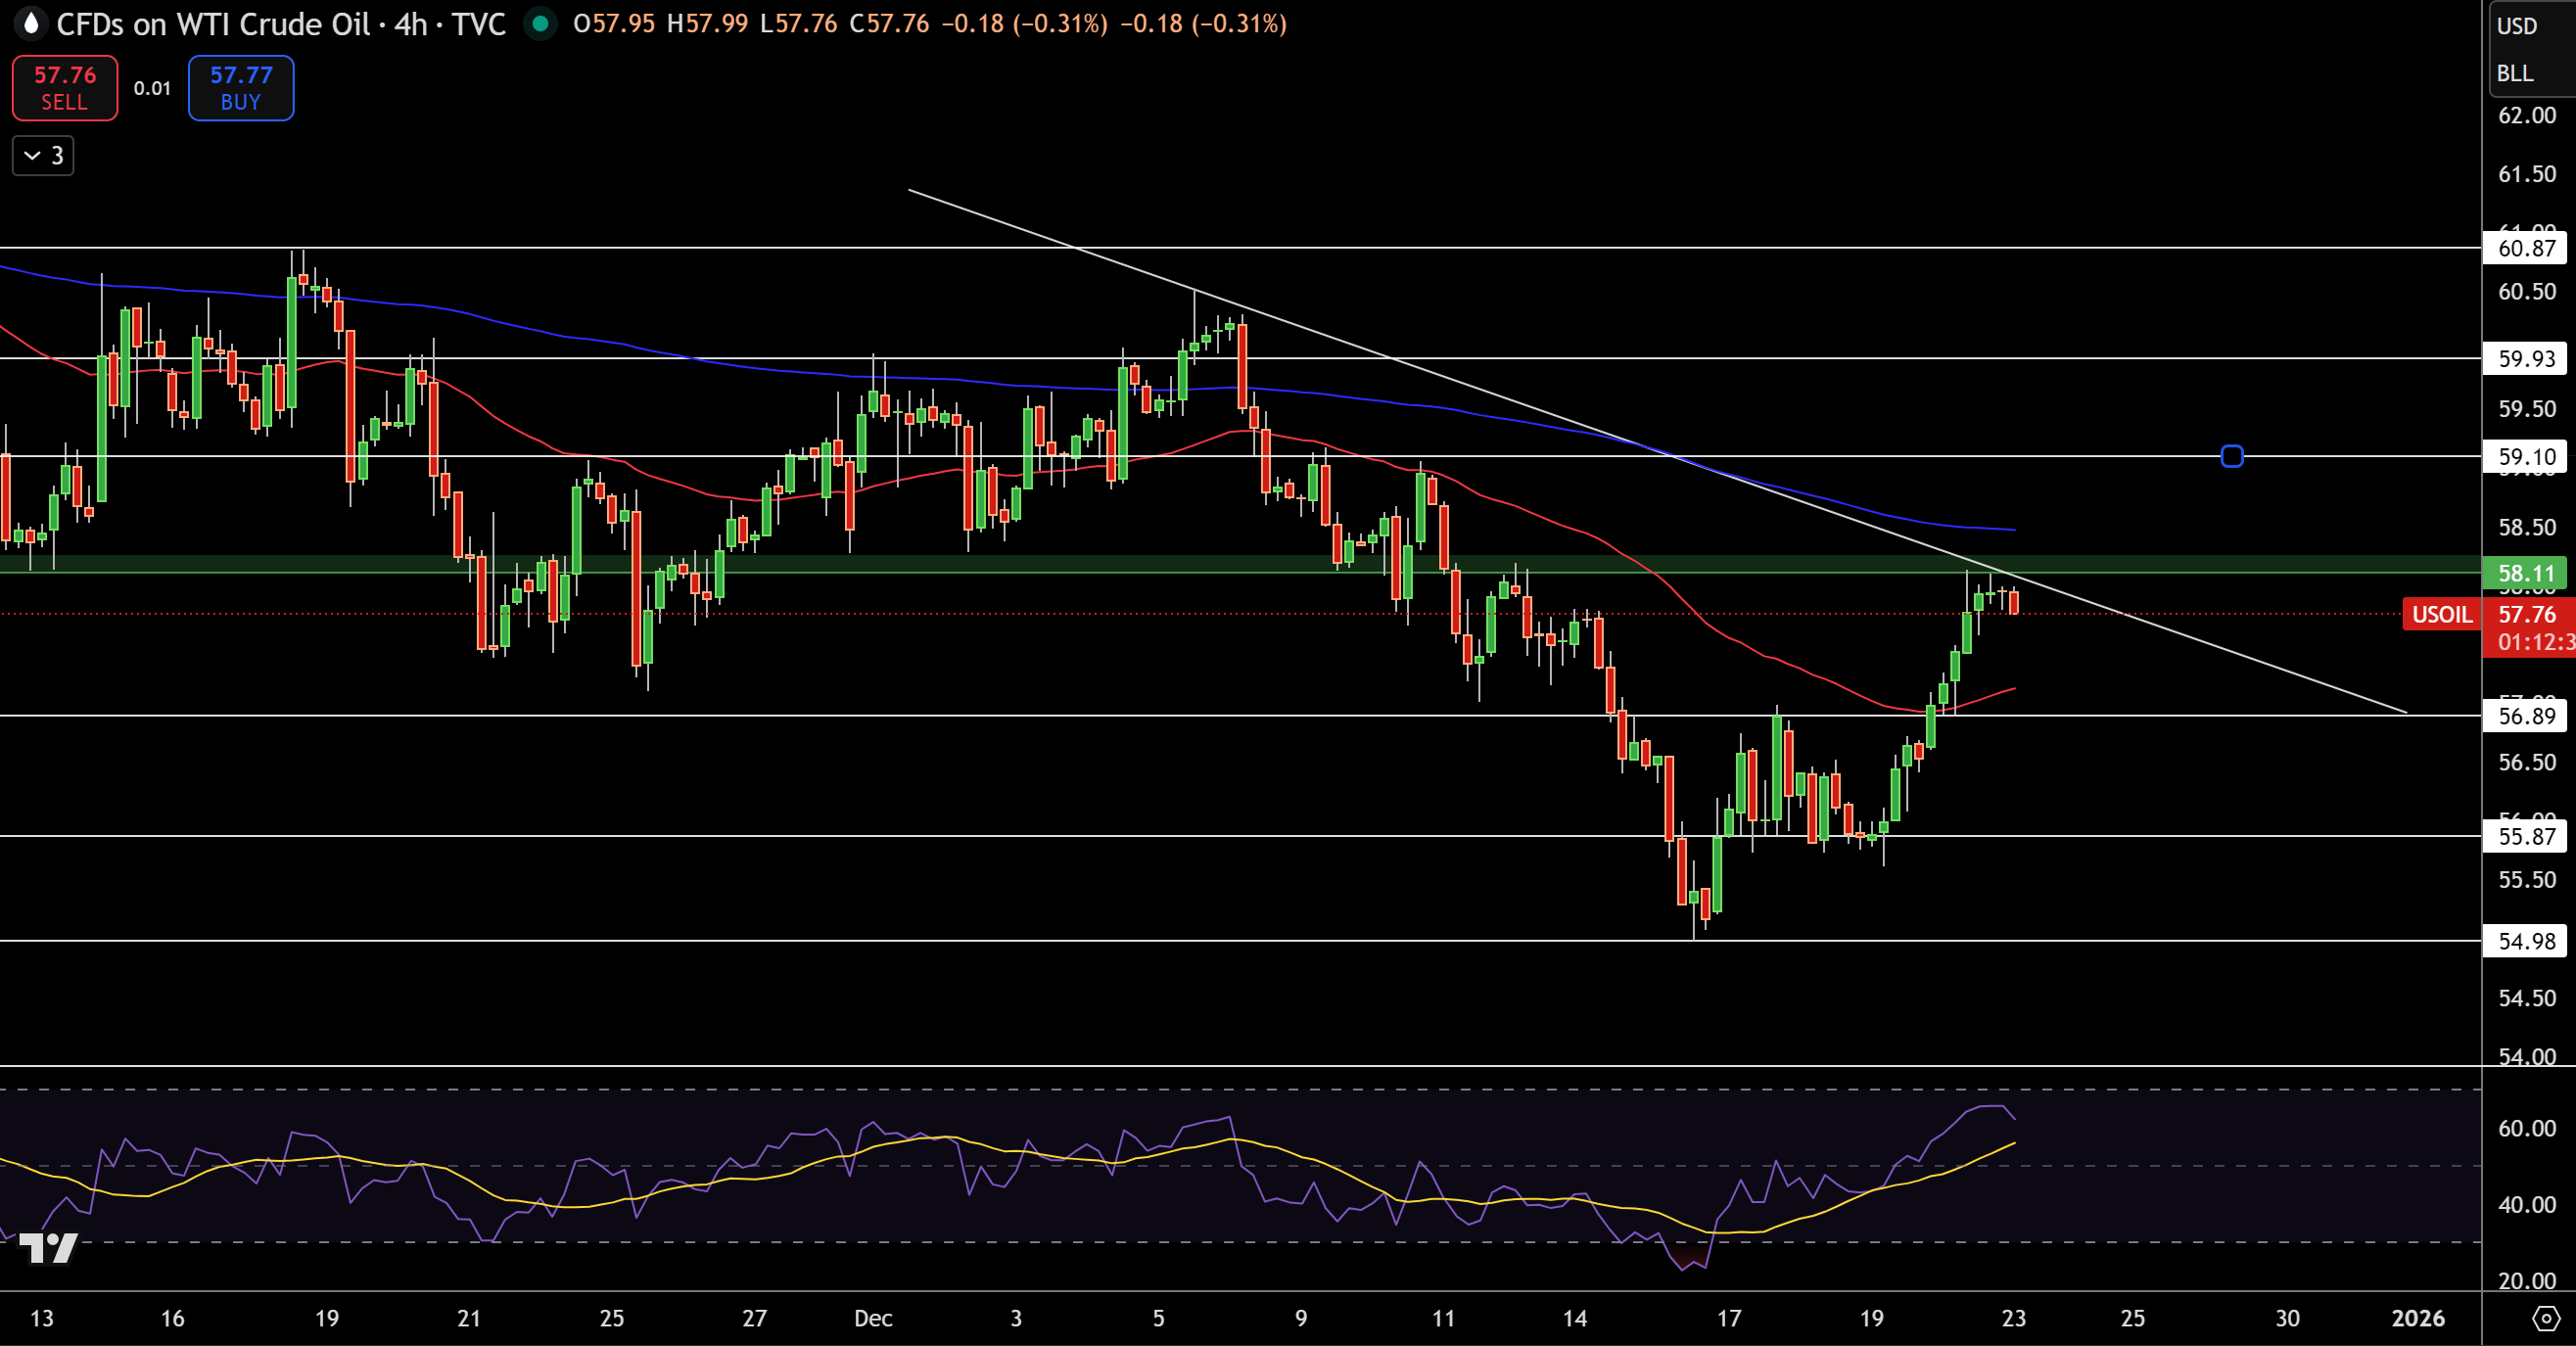
WTI crude oil is trading near $57.80 on the 4H chart, recovering from the recent $55.00 swing low but still capped by a descending trendline. Price remains inside a broader downward channel, with the latest bullish candles showing improving structure but limited follow-through.
The rebound stalled near $58.10, which aligns with a prior support-turned-resistance zone and the descending trendline intersection. The 50-EMA is curling higher near $57.40, offering short-term support, while the 200-EMA above $59.00 continues to cap upside.
RSI has climbed toward 60, signaling strengthening momentum without being overstretched. Fibonacci retracement from $60.90 to $55.00 shows price struggling near the 38.2% level. Trade idea is to buy above $58.20, target $59.90, stop below $56.90.
Brent Oil Price Forecast
Brent Price Chart
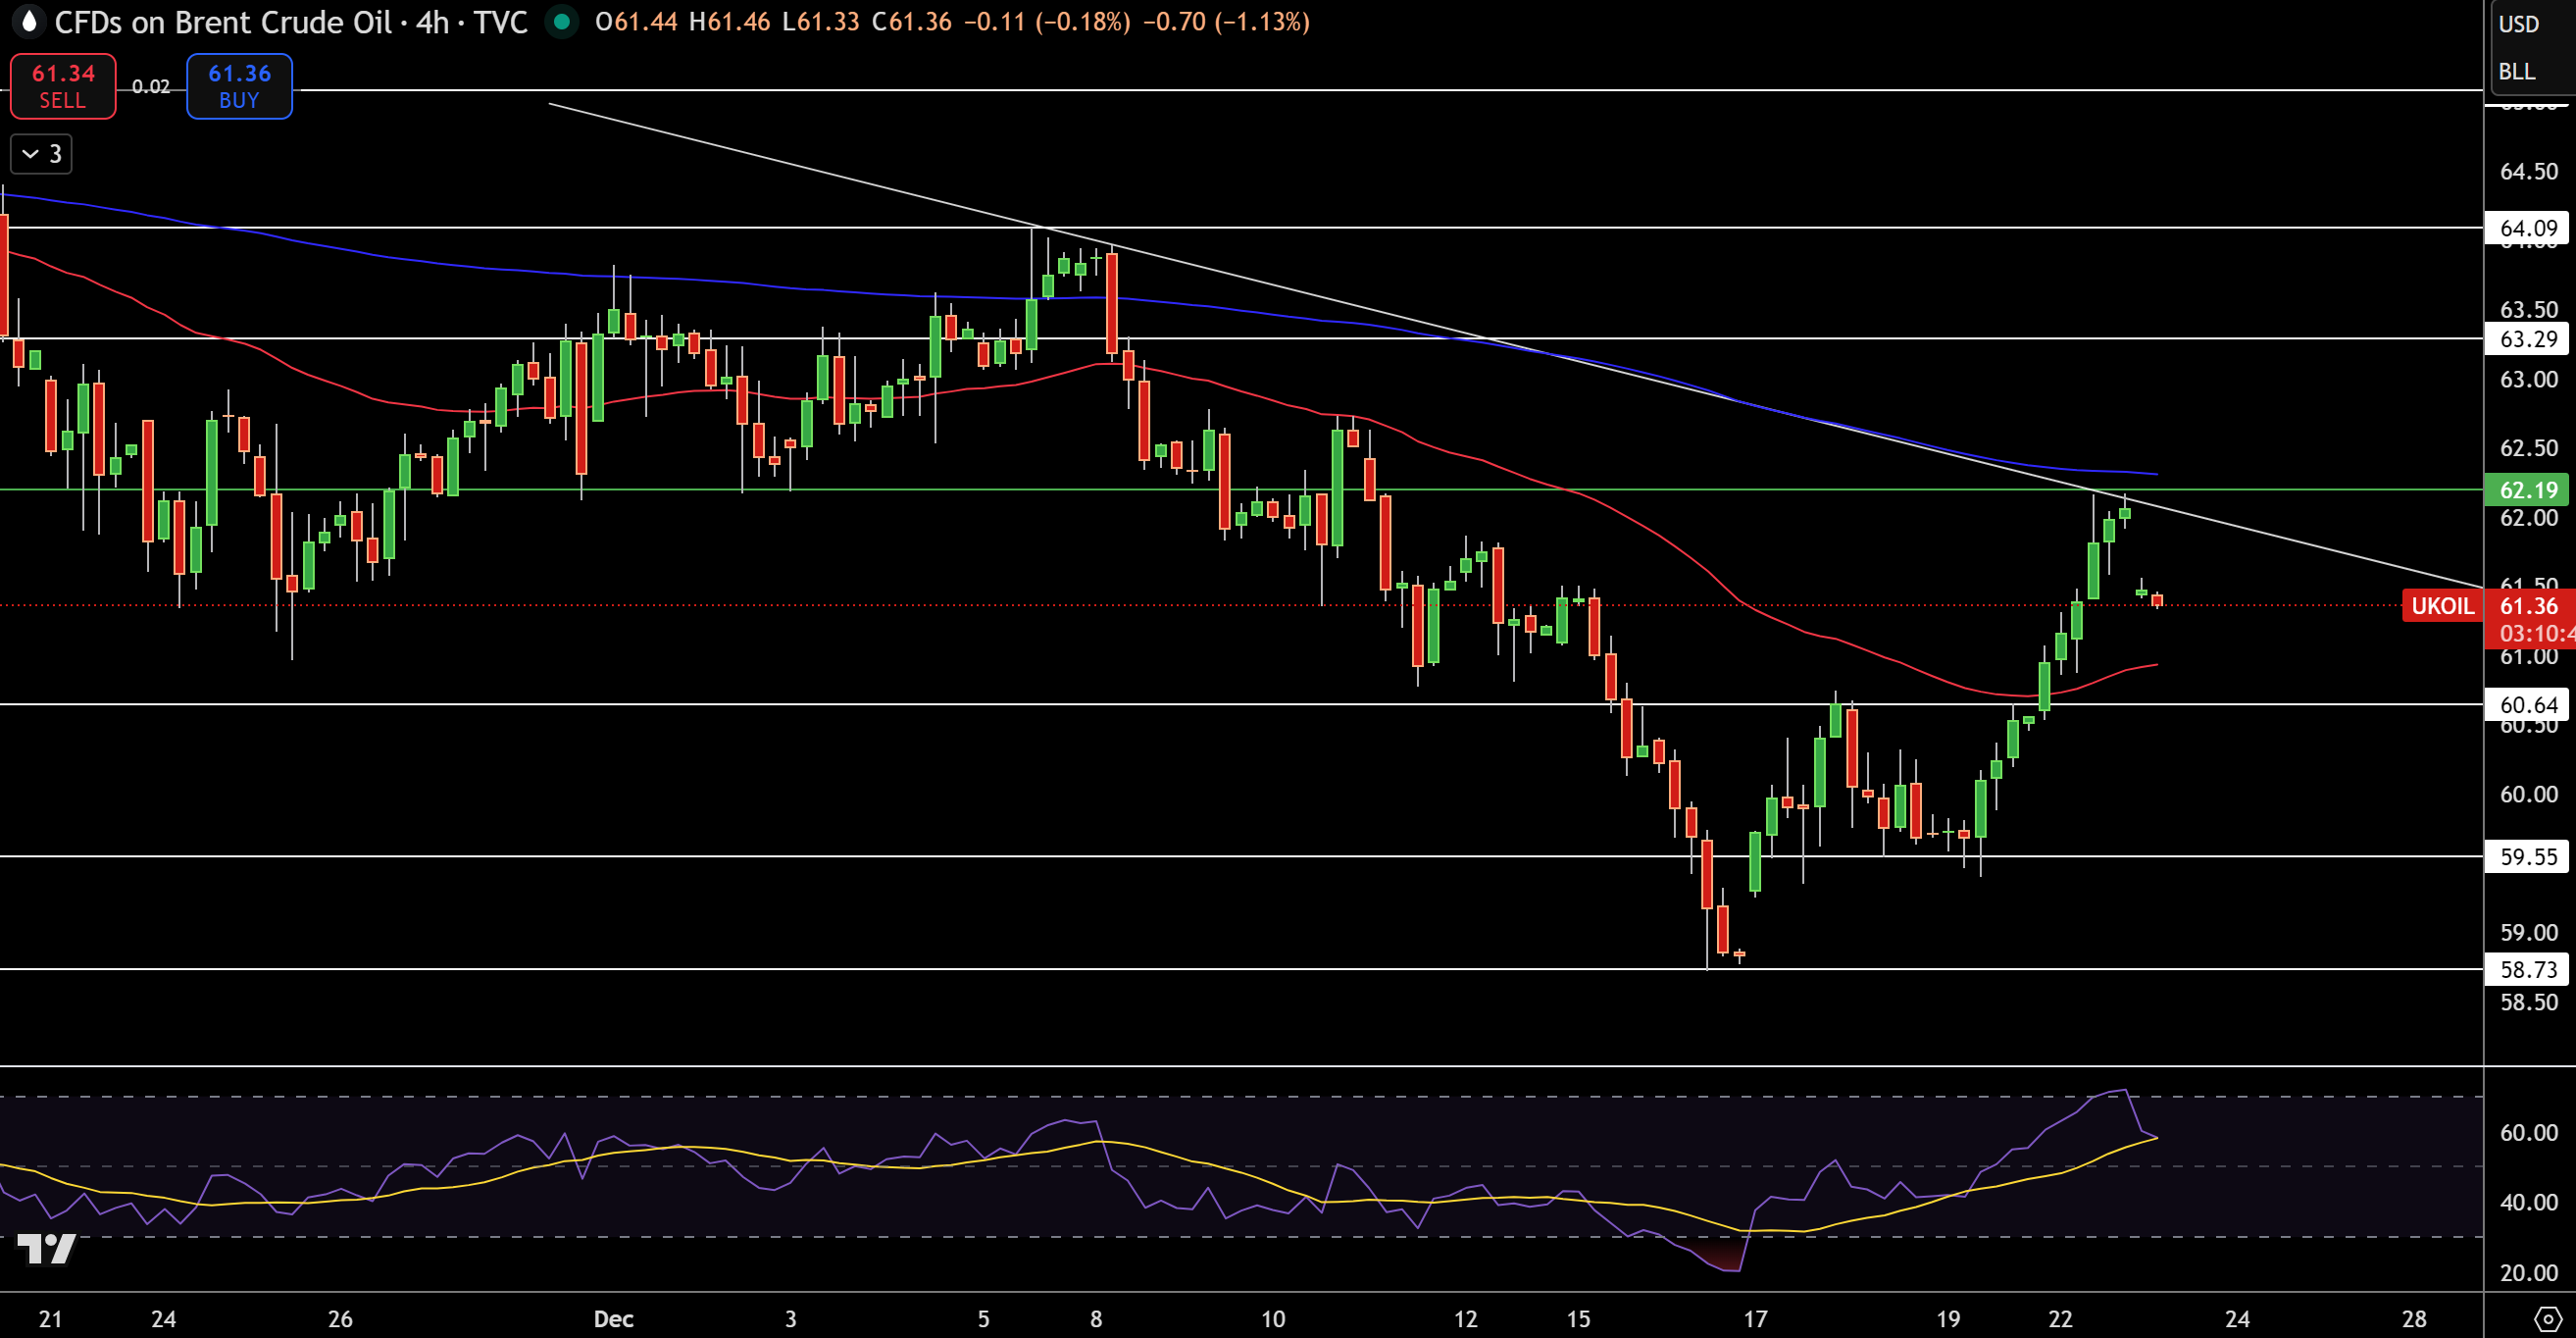
Brent crude is trading near $61.35 on the 4H chart, extending a rebound from the $58.70 low but running into trend resistance. Price is pressing against a descending trendline that has capped rallies since early December, while the broader structure still resembles a downward channel. Recent bullish candles show strong bodies, yet upper wicks near $62.20 signal hesitation at resistance.
The 50-EMA has turned higher around $60.80, offering short-term support, but the 200-EMA near $63.00 remains a ceiling.
RSI has climbed above 55, reflecting improving momentum without reaching overbought territory. Fibonacci retracement from $64.10 to $58.70 places current price near the 38.2% zone, often a decision area. Trade idea is to buy on a break above $62.30, target $63.90, stop below $60.90.